APP “Institute of Agricultural Resources and Economics”
STENDE RESEARCH CENTRE
„Impact of organic products on table beet yield and quality”
Researchers:
MSc in Agriculture, Solveiga Maļecka,
Research assistant Margita Damškalne
APP “Institute of Agricultural Resources and Economics”
Stende Research Centre
Dižstende, 2025
The purpose of the trial:
To compare the effect of organic products on table beet yield and quality in agroclimatic conditions of Kurzeme.
1. Test methodology and conditions
Table 1.1
Test methodology and conditions
| Test site | AREI Stende Research Centre | AREI Stende Research Centre |
| Commissioning client | JikoEnt | JikoEnt |
| Name | „Influence of organic product on table beet yield and quality” | „Influence of organic product on table beet yield and quality” |
| Location | SCL crop sequence field No. 10 | SCL crop sequence field No. 10 |
| Crop | Table beets | Table beets |
| Variety | ‘Kestrel’ (Sakata) | ‘Kestrel’ (Sakata) |
| Sowing rate | 60 d.s. m2 | 60 d.s. m2 |
| Treatment | Controls without NPK | Controls without NPK |
| Treatment | Control with NPK | Control with NPK |
| Treatment | ChitoHumus 0.1 L ha-1 without NPK (C1) | ChitoHumus 0.1 L ha-1 without NPK (C1) |
| Treatment | ChitoHumus 0.2 L ha-1 without NPK (C2) | ChitoHumus 0.2 L ha-1 without NPK (C2) |
| Treatment | ChitoHumus 0.1 L ha-1 with NPK (C1) | ChitoHumus 0.1 L ha-1 with NPK (C1) |
| Treatment | ChitoHumus 0.2 L ha-1 with NPK (C2) | ChitoHumus 0.2 L ha-1 with NPK (C2) |
| Soil type | Velenė podzolēta surface-cut light moraine sandstone | Velenė podzolēta surface-cut light moraine sandstone |
| Soil characteristics | 5.27 pH, organic matter content 2.52 %, K2O 369.5 mg kg-1, P2O5 238.8 mg kg-1 | 5.27 pH, organic matter content 2.52 %, K2O 369.5 mg kg-1, P2O5 238.8 mg kg-1 |
| Soil treatment | Autumn crop in spring sown and cultivated 25.05.2025., following the principle of the only difference | Autumn crop in spring sown and cultivated 25.05.2025., following the principle of the only difference |
| Pre-plant | Papaver | Papaver |
| Basic fertilizer | Complex mineral fertilizer YM NPK 11-11-21 N55 kg ha-1 or 500 kg ha-1 before sowing according to the scheme, handmade | 25.05.2025. |
| Topsoil | Nitrate N35 kg ha-1 or 230 kg ha-1 (N15.4%, (nitrate nitrogen N-NO3 – 14.1%; ammonium nitrogen N-NH4 – 1.3%); calcium oxide (CaO) – 25.6%; calcium (Ca) – 18.6%; boron (B) water-soluble – 0.3%). | 06.07.2025. |
| Foliage fertilizers | Omex Calmax Zero (calcium (Ca) 7.14 %, boron (B) 0.33 %, copper (Cu) 0.04 %, iron (Fe) 0.05 %, manganese (Mn) 0.1 %, molybdenum (Mo) 0.001 %, zinc (Zn) 0.02 %. Density 1.32, pH 5-6) | 04.07.2025. |
| Seed | Provided by the Performer | Provided by the Performer |
| Seed | Hand made | 26.05.2025. |
| Care of volumes | Field measurement according to the trial scheme, weeding and DAP application | |
| Herbicide | - | |
| Fungicide | Score L ha-1 (diphenocanazol 250 g L-1) with a ritch sprayer (for control of leaf spot (Cercospora beticola, Ramularia beticola)) | 04.07.2025. |
| Insecticide | - | |
| Organic product | ChitoHumus (C1 – dose 0.1 L ha-1 and C2 – dose 0.2 L ha-1 used 2x per season with a ritch sprayer, water consumption 200 L ha-1 | 04.07.2025. 12.07.2025. |
| Area | 30 m2 (3.0x10 m) - 4 places | 30 m2 (3.0x10 m) - 4 places |
| Number of variants | 6 | 6 |
| Repeats | 4 | 4 |
| Number of fields | 24 | 24 |
| Area to be counted | 15 m2 (1.5x10 m) - 2 internal grooves | 15 m2 (1.5x10 m) - 2 internal grooves |
| Phenological observations | Sprouting, 13-15 AE | 13.06.2025. 04.07.2025. |
| Recording / observations | Each repeat determined for 5 beets: leaf length, cm; beet weight, kg; root diameter, cm; Brix, % (with Digital Sugar Refractometer) | 25.-26.09.2015. 15.10.2025. |
| Harvesting | determined the yield of each field by hand | 25.-26.09.2025. |
| Data processing | Microsoft Excel using single-factor variance analysis with iterations. | Microsoft Excel using single-factor variance analysis with iterations. |
| Report | Methodology and conditions of the experiment, characteristics of meteorological conditions during the vegetation period, results and their brief description. | Methodology and conditions of the experiment, characteristics of meteorological conditions during the vegetation period, results and their brief description. |
*Selection of fertilizer and AAL is determined by the Institute’s procurement.
2. Trial design
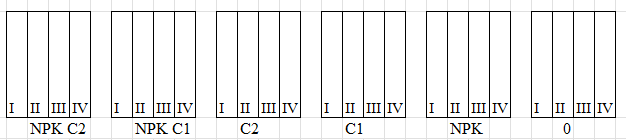
3. Description of meteorological conditions
Table 3.1
Description of meteorological conditions,
2025. (Sende HMS data)
| Ten-day period | Mean air temperature, °C | Mean air temperature, °C | Mean air temperature, °C | Mean air temperature, °C | Mean air temperature, °C | Mean air temperature, °C | Total precipitation, mm | Total precipitation, mm | Total precipitation, mm | Total precipitation, mm | Total precipitation, mm | Total precipitation, mm |
| ten-day period | I | II | III | Monthly mean | Long-term mean | ± from long-term mean | I | II | III | Monthly total | Long-term value | Relative to long-term value, % |
| March | 5.1 | 1.3 | 4.9 | 3.8 | 0.1 | 3.7 | 4.1 | 6.8 | 4.3 | 15.2 | 38.5 | 39 |
| April | 3.2 | 11.1 | 7 | 7.1 | 5.8 | 1.3 | 4.9 | 47.4 | 11.3 | 63.6 | 38.1 | 167 |
| May | 6.3 | 8 | 12.7 | 9.0 | 11.1 | -2.1 | 4.3 | 58.8 | 1.4 | 64.5 | 46 | 140 |
| June | 14.2 | 14.1 | 14.2 | 14.2 | 14.7 | -0.5 | 25.8 | 21.2 | 16.9 | 63.9 | 71.4 | 89 |
| July | 16.5 | 19.3 | 19.3 | 18.4 | 17.3 | 1.1 | 25.4 | 2.2 | 102.1 | 129.7 | 78.1 | 166 |
| August | 17.2 | 16.5 | 13 | 15.6 | 16.6 | -1.0 | 21.9 | 9.9 | 55.2 | 87 | 83.4 | 104 |
Characteristics of meteorological conditions in the 2025 growing season
The average spring temperature in Latvia in 2025 (March–May) was 6.9 °C, which is 1.0 °C above the seasonal norm, thus becoming the 10th warmest spring in the history of observations (since 1924). Stands 1.0 °C above normal. The lowest air temperature this spring (−10.4 °C) was recorded in Alūksne on March 17, while the highest air temperature was +28.4 °C in Skryje. The average air temperature in Latvia was above normal for almost all of March, except for a few days in the middle of the month. Following the two-and-a-half-week heat wave that began in late February, the first half of March was particularly warm. Warm weather conditions continued in the second half of March, as a result of which March with an average air temperature of +3.8 °C was 3.6 °C warmer than normal and became the 2nd warmest March in the history of observations. In early April, the spring weather continued, but after a few days the air temperature dropped and a week-long cool period began. In the middle of the month, the air temperature increased rapidly, reaching a maximum on April 18. The average air temperature in Latvia on 18 April was 17.9 °C, which is 11.8 °C above the normal for this date. Despite cool periods and even recorded minimum air temperature at the end of the month, April with an average air temperature of +7.4 °C was 1.3 °C warmer than the monthly norm. On the other hand, May was cool throughout the country. The average air temperature in Latvia was below normal for almost the whole month, on some days even about 5 °C below normal. In the first half of May, the average air temperature was even lower than in the warm periods of March and April. The average air temperature in Latvia in May was +9.4 °C, which is 2.0 °C below the monthly norm, making May the coldest month in this century.
The total precipitation in spring in Latvia was 147.5 mm, which is 20% above the seasonal norm (123.1 mm). The lowest precipitation was in Vičaci (54.5 mm), while the most rainfall-rich spring was in Madona, where the total precipitation amount was 280.9 mm (105% above the norm). Stands 1.7% of the norm. March with 24.0 mm was the only spring month that was drier than normal (35% below normal). In April, the precipitation amount in Latvia reached 39.2 mm, which is 9% above the norm, while May was the wettest spring month with a total precipitation of 84.7 mm (68% above the norm). In mid-May, prolonged rain was recorded almost throughout Latvia. In Kurzeme, the western Vidzeme and the central regions of the country, the amount of precipitation was relatively low until the end of May, while in Latgale, Sēlija and Eastern Vidzeme, the rain continued, as a result of which May was very wet in these regions. In Madona, where it rained more than 3 times the May norm, this was the wettest May in the history of observations.
Snow was not a frequent phenomenon this spring – in March the average snow cover thickness in Latvia did not reach 1 cm, while in the other months it was 0 cm. In the first days of March, snow cover of up to 8 cm in thickness remained at some stations in the east of the country, but it soon faded. Short-term snow cover in the eastern part of the country also formed in mid-March and early April, but it fell everywhere within one or two days. Snowfall without snow cover formation was observed in the middle of May.
The average air temperature of the calendar summer (June–August) in Latvia was +16.4 °C, which is 0.3 °C below the seasonal norm, thus becoming the coldest summer since 2017. The lowest air temperature this summer (+2.4 °C) was observed in Zosēni on August 21, while the highest air temperature was +32.4 °C, which was recorded on July 3 in both Mersrags and Riga. In Stendē, Latgale and Priekuļi 0.2°C below normal. In the first half of June there were periods with average air temperature above and below normal, while in the second half of the month the average air temperature in the country was below normal, as a result of which June with an average air temperature of +14.5 °C was 0.7 °C colder than normal. At the beginning of July, air temperatures increased rapidly, reaching a peak on 3 July, when daily maximum air temperature records were set at 23 monitoring stations. In the following days in the 1st ten-day period of July the average air temperature fluctuated, some days being several degrees below normal, but in the 2nd and 3rd ten-day period the air temperature increased and the remainder of July was steadily above normal, in Ainaži even a week-long heat wave was registered, and on the night of 20 July a tropical night was observed in Mersrags. The average air temperature in July was +18.9 °C, which is 1.1 °C above normal. In August, the weather was mostly cooler than normal, although some days were warm. The 3rd ten-day period of the month was particularly cool – the average air temperature for several days was even below +12.0 °C, which is about 4.0 °C below normal. Although the air temperature increased at the very end of August, August with an average air temperature of +15.9 °C was 1.0 °C colder than normal and became the coldest in this century (including 2012).
The summer of 2025, with a total rainfall of 272.6 mm, was 22% wettier than the normal (222.6 mm), becoming the wettest summer since 2016. Only at some stations the summer was drier than normal. However, in most of Latvia this summer was wetter than usual, especially in the eastern part of the country. In Gulbene the summer was the wettest with total precipitation of 414.0 mm or 88% above the station seasonal norm. In Stendē 20%, Rēzekne 25%, Dobele 15%, Priekuļi 26% above the norm.
The beginning of June was very humid throughout Latvia, in many observation stations in the 1st ten-day period the amount of precipitation was twice or even three times greater than the ten-day period norm, and on average the ten-day period was 123% wetter than the norm. In the 2nd and 3rd ten-day period of June, rainfall was less in most of the country, but in the eastern part of the country, especially in eastern Vidzeme and Latgale, rainfall was frequent. The first two days of July were without precipitation throughout the country, and also on 3 and 4 July significant precipitation (at least 1 mm) was observed only at selected stations. However, after that the wet weather returned, the most precipitation was observed in eastern Vidzeme and Latgale. On July 9–11, 85.4 mm of rain fell in Madona, which already exceeds the station’s monthly norm of 67.4 mm. However, also elsewhere in Latvia days with intense precipitation were observed in July – in Kalnciems on July 16 (51.1 mm), in Liepaja on July 20 (39.3 mm), in Stendē on July 23 (39.1 mm). At the end of July and the beginning of August a lot of precipitation was observed in the middle of Kurzeme and Zemgale – especially on 30 July, when the precipitation in Dobele, Kuldīga and Stendē exceeded 30.0 mm, and in Saldus 52.9 mm fell during the day. The night to 1 August was also rainy, in Riga the precipitation amount reached 41.7 mm, while on 4 August in Gulbene it fell 49.4 mm in two hours. In the middle of August, rainfall ceased in most of the country, while at the end of August rainy weather returned to Kurzeme and the surroundings of Riga.
June and July were both wet. In June, the total precipitation in Latvia reached 91.1 mm, which is 30% above the norm, and in July – 107.0 mm, which is 41% above the norm. August with 73.9 mm was the only summer month that was drier than normal (4% below normal), albeit only slightly.
4. Results
A medium-late red table beet variety Kestrel, which is perfectly suited to Latvian climatic conditions and has proven itself well in Estonia. Beetroot of the Kestrel variety has neat, round roots. Beetroot has good taste properties and can be used both fresh and processed. Vegetables are well suited for both transport and storage.
The use of basic fertilizer provides 4-33% higher yields. The proportion of large beet was higher in fertilized varieties. On average, the total number of beet roots (51-55 pcs.) in the unfertilized variants was higher in the repeat. Significantly higher yields were obtained when using the bioproduct without fertilizer.
When analyzing the average sample (medium size roots), it is shown that in the fertilized variants, using the bioproduct, significantly higher root weight was obtained, but in the unfertilized, using the bioproduct 0.2 L ha-1. Similar results are shown by the analysis of the average sample sheet length. The sugar content of beet roots was equivalent in all variants.
For objective evaluation of the bio-product, the trials need to be continued, because one year results give an incomplete picture of the effects of the investigated products in different agroclimatic conditions.
Table 4.1
Table beet root harvest, Stendes PC, 2025.
| Variant | Table beet yield, t ha-1 | Table beet yield, t ha-1 | Table beet yield, t ha-1 | Table beet yield, t ha-1 | Vid. | against K, t ha-1 | against K, % |
| NPK 0 | 49.40 | 38.05 | 33.70 | 52.33 | 41.36 | ||
| NPK0 C1 | 52.45 | 44.10 | 42.53 | 55.15 | 47.26 | 5.900 | 114.3 |
| NPK0 C2 | 52.93 | 54.90 | 62.10 | 56.00 | 57.67 | 16.308 | 139.4 |
| NPK | 72.83 | 50.60 | 56.48 | 58.93 | 55.33 | ||
| NPK C1 | 71.80 | 60.88 | 47.25 | 80.40 | 62.84 | 7.508 | 113.6 |
| NPK C2 | 68.70 | 53.80 | 62.98 | 62.98 | 59.92 | 4.583 | 108.3 |
| RS0.05 | - | - | - | - | 13.081 | 13.081 | - |
Table 4.2
Table beet harvest root fractions, Stendes PC, 2025.
| - Yes, I did. Designation | Large | Large | Large | Average | Average | Average | Small | Small | Small | Total pcs, | Total kg |
| - Yes, I did. Designation | gb | kg | % of total | gb | kg | % of total | gb | kg | % of total | Total pcs, | Total kg |
| NPK 0 | 1.9 | 0.729 | 3.9 | 19.6 | 2.784 | 40.6 | 26.9 | 0.823 | 55.6 | 48.4 | 4.337 |
| NPK0 C1 | 1.4 | 0.679 | 2.7 | 20.9 | 3.149 | 41.0 | 28.6 | 1.028 | 56.3 | 50.9 | 4.856 |
| NPK0 C2 | 2.0 | 0.913 | 3.6 | 22.4 | 3.591 | 40.8 | 30.5 | 1.144 | 55.6 | 54.9 | 5.648 |
| NPK | 3.0 | 1.435 | 5.9 | 24.0 | 3.904 | 47.2 | 23.9 | 0.632 | 46.9 | 50.9 | 5.971 |
| NPK C1 | 3.8 | 2.161 | 8.3 | 19.6 | 3.647 | 43.3 | 22.0 | 0.700 | 48.5 | 45.4 | 6.508 |
| NPK C2 | 2.4 | 1.184 | 4.8 | 21.3 | 3.415 | 42.5 | 26.4 | 0.865 | 52.7 | 50.1 | 5.464 |
Table 4.3
Average root weight of the sample, Standes PC, 2025.
| - Yes, I did. Description | Root weight, kg (at harvest, avg. 5 beets) | Root weight, kg (at harvest, avg. 5 beets) | Root weight, kg (at harvest, avg. 5 beets) | Root weight, kg (at harvest, avg. 5 beets) | Vid. | against K, % | against K, kg |
| NPK 0 | 0.201 | 0.16 | 0.156 | 0.219 | 0.184 | ||
| NPK0 C1 | 0.224 | 0.211 | 0.212 | 0.215 | 0.216 | 117.1 | 0.032 |
| NPK0 C2 | 0.254 | 0.252 | 0.257 | 0.242 | 0.251 | 136.5 | 0.067 |
| NPK | 0.228 | 0.203 | 0.208 | 0.198 | 0.209 | ||
| NPK C1 | 0.299 | 0.281 | 0.257 | 0.298 | 0.284 | 135.6 | 0.075 |
| NPK C2 | 0.253 | 0.321 | 0.284 | 0.355 | 0.303 | 144.9 | 0.094 |
| RS0.05 | - | - | - | - | - | - | 0.036 |
Table 4.4
Average root diameter of the sample, Stand PC, 2025.
| - Yes, I did. Description | Root diameter, cm (at harvest, avg. 5 beets) | Root diameter, cm (at harvest, avg. 5 beets) | Root diameter, cm (at harvest, avg. 5 beets) | Root diameter, cm (at harvest, avg. 5 beets) | Vid. | against K, % | against K, cm |
| NPK 0 | 7.3 | 6.1 | 6.4 | 7.4 | 6.8 | ||
| NPK0 C1 | 7.4 | 7.8 | 7.8 | 7 | 7.5 | 110.3 | 0.7 |
| NPK0 C2 | 7.1 | 6.8 | 7 | 6.7 | 6.9 | 101.5 | 0.1 |
| NPK | 7 | 7 | 6.6 | 7.1 | 6.9 | ||
| NPK C1 | 7.5 | 7.5 | 7.4 | 7.6 | 7.5 | 108.3 | 0.6 |
| NPK C2 | 7.1 | 7.9 | 7.7 | 8.3 | 7.8 | 111.9 | 0.8 |
| RS0.05 | 0.577 |
Table 4.5
Average root sugar content of the sample, Stendes PC, 2025.
| - Yes, I did. Description | Brix, % (at harvest, avg. 5 beets) | Brix, % (at harvest, avg. 5 beets) | Brix, % (at harvest, avg. 5 beets) | Brix, % (at harvest, avg. 5 beets) | Vid. | against K, % | % |
| NPK 0 | 9.1 | 10.3 | 10.6 | 10.8 | 10.2 | ||
| NPK0 C1 | 10.7 | 11.2 | 10.7 | 11.7 | 11.1 | 108.6 | 0.9 |
| NPK0 C2 | 12 | 11.1 | 10.9 | 8.8 | 10.7 | 104.9 | 0.5 |
| NPK | 11 | 10.8 | 12.1 | 12.6 | 11.6 | ||
| NPK C1 | 12.5 | 12 | 11.6 | 11.5 | 11.9 | 102.4 | 0.3 |
| NPK C2 | 11 | 11 | 12.3 | 11.5 | 11.5 | 98.5 | -0.2 |
| RS0.05 | 1.209 |
Table 4.6
Average sample sheet weight, Stand PC, 2025.
| - Yes, I did. Description | Leaf weight, kg (at harvest, avg. 5 beets) | Leaf weight, kg (at harvest, avg. 5 beets) | Leaf weight, kg (at harvest, avg. 5 beets) | Leaf weight, kg (at harvest, avg. 5 beets) | Vid. | against K, % | against K, kg |
| NPK 0 | 0.097 | 0.062 | 0.075 | 0.071 | 0.076 | ||
| NPK0 C1 | 0.092 | 0.074 | 0.076 | 0.095 | 0.084 | 110.5 | 0.008 |
| NPK0 C2 | 0.122 | 0.319 | 0.099 | 0.124 | 0.166 | 217.7 | 0.090 |
| NPK | 0.085 | 0.106 | 0.079 | 0.081 | 0.088 | ||
| NPK C1 | 0.111 | 0.107 | 0.111 | 0.119 | 0.112 | 127.6 | 0.024 |
| NPK C2 | 0.107 | 0.127 | 0.146 | 0.137 | 0.129 | 147.3 | 0.042 |
| RS0.05 | - | - | - | - | - | - | 0.065 |
Table 4.7
Average sample sheet length, Stand PC, 2025.
| - Yes, I did. Description | Leaf length, cm (at harvest, avg. 5 beets) | Leaf length, cm (at harvest, avg. 5 beets) | Leaf length, cm (at harvest, avg. 5 beets) | Leaf length, cm (at harvest, avg. 5 beets) | Vid. | against K, % | against K, cm |
| NPK 0 | 43.8 | 37.2 | 41.2 | 38.2 | 40.1 | ||
| NPK0 C1 | 42.2 | 44.0 | 46.4 | 47 | 44.9 | 112.0 | 4.8 |
| NPK0 C2 | 41.4 | 44.4 | 40.2 | 42 | 42 | 104.7 | 1.9 |
| NPK | 41 | 44.2 | 39.4 | 41.6 | 41.55 | ||
| NPK C1 | 46.6 | 47.4 | 43 | 47.2 | 46.05 | 110.8 | 4.5 |
| NPK C2 | 42.6 | 46.2 | 45.4 | 48.6 | 45.7 | 110.0 | 4.2 |
| RS0.05 | 3.40 |
Field trials manager
Solveiga Maļecka
08.01.2026.