Client: SIA JIKO Ent
Contractor: Research Assistant Lauris Arbidans
Faculty of Exact Sciences and Technologies, Department of Environmental Science, University of Latvia
Address: Jelgavas iela 1, LV-1004, Riga
Report
Chemical Evaluation of a Peat and Mushroom Biostimulant within LIAA Voucher No. 9.2-29-V-2025/64
Riga, 2026
Work tasks
To perform comprehensive physico-chemical and agronomic characterization of a peat and mushroom biostimulant, commissioned by SIA JIKO Ent within the framework of LIAA Voucher No. 9.2-29-V-2025/64. The characterization includes:
Germination tests on three (3) crops (peas, durum wheat, oats), assessing the effectiveness of the biostimulant at different concentrations;
Assessment of the biostimulant’s effect on germination when applying a seed etching treatment;
Determination of humic acids and fulvic acids content in the product using spectrophotometric and TOC methods;
Determination of proteins, carbohydrates, and chitin content to characterize the profile of bioactive components in the biostimulant;
Quantitative determination of micro- and macro-elements using ICP-OES and the Kjeldahl method;
Physico-chemical characterization of humic acids using FTIR, UV-Vis, and FLR 3D-EEM spectroscopy.
Materials and methods
Sample
In August 2025, the biostimulant was delivered in a 5 L canister, labeled SK-04-S01-N.
Chitin isolation
100 mL of biostimulant was centrifuged for 30 minutes at 4500 rpm. After centrifugation, the solid residue was collected, resuspended in 0.1 M NaOH, and stirred for 60 minutes. The sample was then centrifuged again at 4500 rpm for 30 minutes. The process was repeated 3 times until the presence of humic substances in the sample was no longer detected. The solid residue was washed with deionized water to pH < 9. Then 1 M NaOH was added and, while stirring, the sample was heated to 70 °C for 2 hours and centrifuged. The solid residue was rinsed with deionized water to neutral pH, then 0.5 M HCl was added and the sample was centrifuged again. The sample was rinsed to neutral pH with deionized water, then 1% NaClO was added and mixed at room temperature for 60 minutes. After that, the sample was washed with 70% ethanol and dried for 3 hours in a drying oven at 40 °C.
Humic acids extraction
200 mL of biostimulant was filtered through filter paper. After filtration, the solution was centrifuged in a laboratory centrifuge at 4500 rpm. After centrifugation, the solution was acidified with HCl to pH < 1, filtered, and the precipitated humic acids were washed with 0.1 M CaCl₂ solution. Then they were washed with deionized water to neutral pH and dried in a drying oven for 2 hours at 105 °C.
Quantitative determination of fulvic and humic acids
The biostimulant was centrifuged at 4500 rpm and the liquid fraction was collected. The sample was diluted 50-fold and measured spectrophotometrically at 410 nm. Concentration was calculated from a calibration curve obtained from the extracted humic acids. After humic acids extraction, the fulvic acid solution separated from the biostimulant was collected separately, diluted 10-fold, and measured spectrophotometrically at 410 nm using a fulvic acid standard as reference.
Using an automatic 1000 µL pipette, 500 µL of biostimulant solution was quantitatively transferred into a 100 mL volumetric flask. In a separate 100 mL volumetric flask, 500 µL of the separated fulvic acid solution was transferred and diluted to the mark with deionized water. The diluted solutions were analyzed with a total organic carbon analyzer (Shimadzu TOC-V CSN) and results were expressed as milligrams of organic carbon (TOC) per liter of biostimulant.
UV-Vis molecular absorption spectra
20 mg of extracted and purified humic acid was weighed on analytical scales, quantitatively transferred into a 1 L volumetric flask, and dissolved in 0.5 M NaHCO₃ solution. Solutions were measured in a 1 cm quartz cuvette using a UV-VIS spectrophotometer UV-1800 in the range 220–700 nm with a step of 1 nm. For humic acid characterization, absorbance ratios at wavelengths 254 nm (E2), 365 nm (E3), 465 nm (E4), and 665 nm (E6) were used and expressed as E2/E3, E2/E4, E2/E6, and E4/E6.
FTIR spectroscopy
Before analysis, KBr was dried for 2 hours at 105 °C. Then 200 mg was weighed, 2 mg of humic acid was added and mixed. The mixture was pressed into a pellet and measured with an FTIR spectrometer (Shimadzu IR-Tracer 100). Measurements were performed in the range 4000–400 cm⁻¹ with a resolution of 8 cm⁻¹ and 16 scans.
Fluorescence 3D excitation/emission matrices (FLR 3D-EEM)
FLR 3D-EEM matrices were obtained using a HORIBA Jobin Yvon Aqualog fluorescence spectrophotometer. Solutions were prepared in 0.5 M NaHCO₃ at a concentration of 20 mg/L. Samples were measured in 1 cm quartz cuvettes without ground sides. Excitation wavelengths: 240–600 nm; emission wavelengths: 260–620 nm. Step size: 3 nm. After measurements, first-order Rayleigh scattering was masked. Fluorescence spectral data were processed and visualized using RStudio (version 2024.12.1.563) and R (version 4.5.0) libraries readxl, dplyr, akima, and ggplot2. Data were interpolated using a linear two-dimensional method (akima::interp) as a function of excitation and emission wavelengths.
Total carbohydrates analysis
For analysis, 1 mL of sample was transferred into a glass test tube, 1 mL of 5% phenol solution was added, and the sample was incubated for 10 minutes. Then 4 mL of concentrated H₂SO₄ was added, incubated for 20 minutes, and measured spectrophotometrically at 490 nm. Samples were measured in 3 replicates using glucose as a standard.
Microelement analysis
Approximately 5 mL of biostimulant was weighed into PTFE vessels, dried to dryness, and 10 mL of concentrated HNO₃ was added. Vessels were placed in pressure-resistant holders, sealed, and wet digestion was performed using a microwave digestion system (Milestone Ethos EASY). The sample was heated for 15 minutes to 200 °C at a maximum power of 1800 W, held for another 15 minutes, and after digestion cooled to room temperature. The sample was quantitatively transferred into a 50 mL polypropylene tube and diluted to 50 mL using deionized water (0.055 µS/cm). Samples were prepared in 2 replicates.
Before analysis, the sample was additionally diluted 10-fold and analyzed using an inductively coupled plasma optical emission spectrometer (Thermo Scientific iCAP 7200 series). ICP parameters: RF power 1150 W; plasma gas flow (argon 5.0) 12 L/min; nebulizer gas flow 0.5 L/min; auxiliary gas flow (nitrogen 5.0) 0.15 L/min; sample flow rate 1 mL/min. A total of 29 elements were determined: Al (396.152 nm, radial); As (189.042 nm, axial); B (249.773 nm, radial); Ba (455.403 nm, axial); Be (313.042 nm, radial); Ca (422.673 nm, radial); Cd (228.802 nm, axial); Co (228.616 nm, axial); Cr (267.716 nm, axial); Cu (324.754 nm, axial); Fe (240.488 nm, radial); K (766.490 nm, radial); Li (670.784 nm, radial); Mg (285.213 nm, radial); Mn (257.610 nm, radial); Mo (202.030 nm, axial); Na (589.592 nm, radial); Ni (231.604 nm, axial); P (177.495 nm, axial); Pb (220.353 nm, axial); S (180.731 nm, axial); Sb (206.833 nm, axial); Se (196.090 nm, axial); Si (251.611 nm, radial); Sr (407.771 nm, radial); Ti (334.941 nm, radial); Tl (190.856 nm, axial); V (292.402 nm, axial); Zn (213.856 nm, axial). Calibration curves were prepared using standardized reference materials.
Total nitrogen determination (Kjeldahl)
0.5 g of fully dried, unfiltered biostimulant sample was weighed on analytical scales and transferred into a Kjeldahl flask. 10 mL of concentrated H₂SO₄ was added and the sample was heated in a Kjeldahl digestion unit (Buchi SpeedDigester K-436 equipped with an acid neutralization module Buchi Scrubber K-415) for 2 hours until the entire matrix was mineralized. After digestion, the sample was distilled using a Buchi KjelFlex K-360 and the distillate was titrated with 0.05 M H₂SO₄.
Tested seeds
Durum wheat (Triticum durum) and oats (Avena sativa) were harvested in late August 2025 in Aknīste Parish. Peas (Pisum sativum) were purchased in October 2025 from the retail store Depo in Riga.
Germination tests
Four biostimulant test concentrations were selected: 1:500, 1:350, 1:200, and 1:100 (obtained by diluting the biostimulant 500-, 350-, 200-, and 100-fold). To evaluate the effect of etching, seeds were etched using 1% NaOH and marked with the respective dilution and “kod” (etched). Seeds were mixed in NaOH solution for 2 minutes and rinsed with deionized water. Before sowing on germination plates, seeds were kept overnight in the respective biostimulant dilutions. 10 mL of biostimulant dilution was applied to each germination plate and 10 seeds were placed on it. Plates were sealed and incubated in a thermostat at 22 °C for 7 days with a 12 h light / 12 h dark cycle for all seed types. Deionized water was used as the control.
Results
To evaluate the composition of the biostimulant, the content of humic acids, fulvic acids, total proteins, total carbohydrates, total nitrogen, total organic carbon in the biostimulant, and total organic carbon in the separated fulvic acid solution were determined. Results are shown in Table 1.
Table 1. Overall indicator results of the biostimulant
| Parameter | Result | Unit |
| Dry matter content | 12,19 ± 0,17 | % |
| Humic acids | 624 ± 12 | mg/L |
| Fulvic acids | 712 ± 21 | mg/L |
| Total protein | 1,30 ± 0,07 | % |
| Total carbohydrates | 198 ± 6 | mg/L |
| Total nitrogen | 0,21 ± 0,04 | % |
| TOC – biostimulant | 1150 ± 40 | mg/L |
| TOC – fulvic acid solution | 790 ± 30 | mg/L |
Table 1 reflects the overall composition indicators of the biostimulant. A high dry matter content was observed (12,19 ± 0,17%), mainly consisting of colloidal particles in the solution. Among humic substances, fulvic acids dominate in the product (712 ± 21 mg/L), while the measured humic acid content is 624 ± 12 mg/L. Attention should be paid to the fact that the product contains a considerable amount of various soluble by-products; therefore, the humic acid content based on organic carbon analyses is not unambiguous. However, analyses of the solution separated from humic acids show a tendency indicating a loss of 360 mg/L C from the product upon removal of humic-acid-associated carbon. This can be approximated to ~720 mg/L humic acids, assuming an average carbon content of 50% in humic acids, but the validity of this conclusion should be assessed critically; therefore, the spectrophotometric analysis is considered the more reliable value.
During sequential isolation and purification of chitin from the biostimulant sample as described in the workflow—first separating humic substances, then removing proteins, followed by a demineralization process, then a material bleaching step (removal of other organic pigments), and finally a step to remove lipophilic compounds and drying—an off-white (grayish-white) chitin was obtained with a total content of ~235 mg/L. The purified chitin is shown in Figure 1.
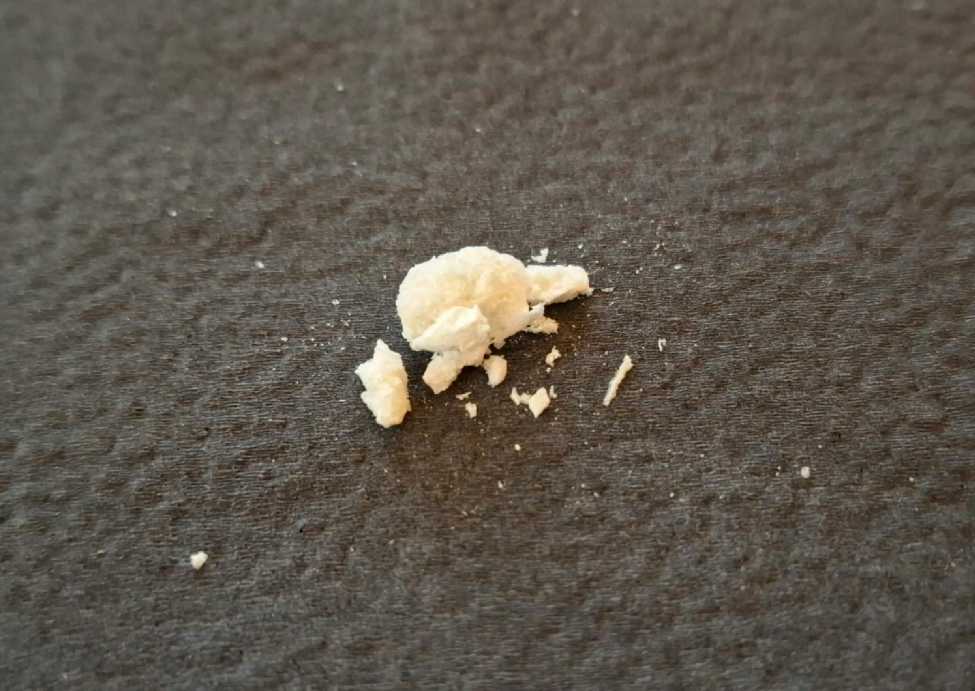
Figure 1. Chitin separated and purified from the biostimulant.
Micro- and macro-element analysis of the biostimulant was performed using the ICP-OES method. In total, 29 elements were determined (Al, As, B, Ba, Be, Ca, Cd, Co, Cr, Cu, Fe, K, Li, Mg, Mn, Mo, Na, Ni, P, Pb, S, Sb, Se, Si, Sr, Ti, Tl, V, Zn). Results are shown in Table 2.
Table 2. Micro- and macro-element composition of the biostimulant (µg/L)
| Element | Concentration (µg/L) |
| Al | 143 ± 5 |
| As | <1,77 |
| B | 1,057 ± 0,114 |
| Ba | 0,28 ± 0,09 |
| Be | <0,014 |
| Ca | 348 ± 12 |
| Cd | <0,15 |
| Co | <0,25 |
| Cr | 0,462 ± 0,007 |
| Cu | 1,82 ± 0,16 |
| Fe | 36,3 ± 0,4 |
| K | 34955 ± 1880 |
| Li | <0,65 |
| Mg | 45,83 ± 0,02 |
| Mn | 0,57 ± 0,05 |
| Mo | <0,80 |
| Na | 150 ± 3 |
| Ni | 0,381 ± 0,008 |
| P | 17370 ± 740 |
| Pb | <1,12 |
| S | 104 ± 5 |
| Sb | <2,44 |
| Se | <2,00 |
| Si | 23 ± 4 |
| Sr | 1,053 ± 0,013 |
| Ti | 0,57 ± 0,19 |
| Tl | <2,89 |
| V | <0,12 |
| Zn | 2,19 ± 0,13 |
According to the elemental analysis data (Table 2), potassium and phosphorus clearly dominate the biostimulant prototype (K 34955 ± 1880; P 17370 ± 740), at concentrations several orders of magnitude higher than other elements. Thus, the formulation is oriented toward a K/P-driven physiological effect: energy metabolism, root development, osmoregulation and stress tolerance. The next concentration level includes Ca 348 ± 12; Na 150 ± 3; Al 143 ± 5; S 104 ± 5, while Mg is relatively low (Mg 45.83 ± 0.02). Among microelements, Fe is most prominent (Fe 36.3 ± 0.4); the following are also present: Si 23 ± 4; Zn 2.19 ± 0.13; Cu 1.82 ± 0.16; B 1.057 ± 0.114; Sr 1.053 ± 0.013; Mn 0.57 ± 0.05. The remaining elements occur at low concentrations (Cr 0.462 ± 0.007; Ni 0.381 ± 0.008; Ba 0.28 ± 0.09; Ti 0.57 ± 0.19). Positively, several potentially toxic elements are below the detection limit (As < 1.77; Cd < 0.15; Pb < 1.12; V < 0.12; Co < 0.25; Mo < 0.80; Se < 2.00; Sb < 2.44; Tl < 2.89; Be < 0.014), which indicates the absence of heavy metals in the product.
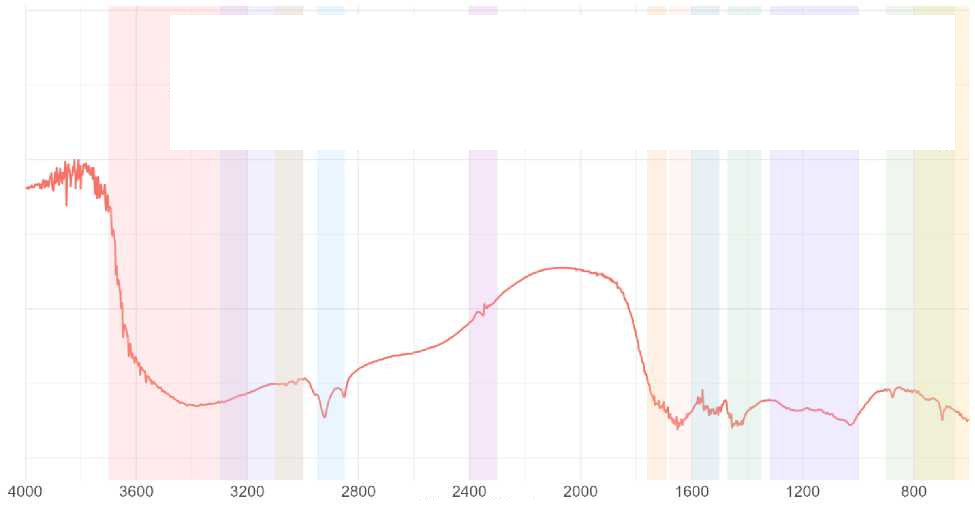
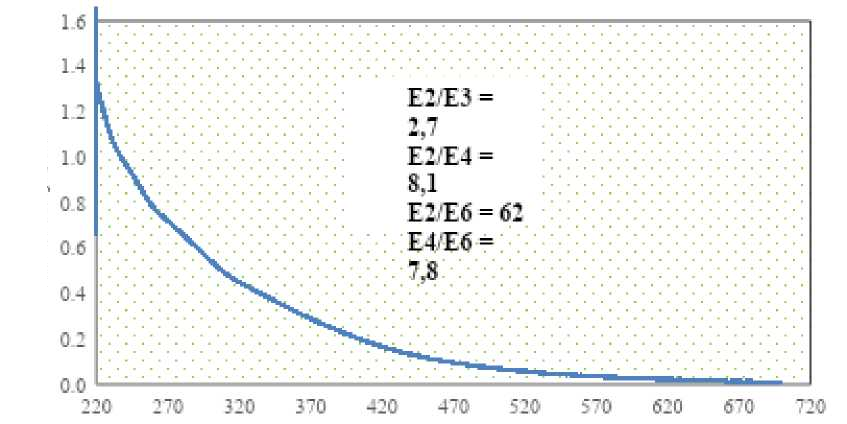
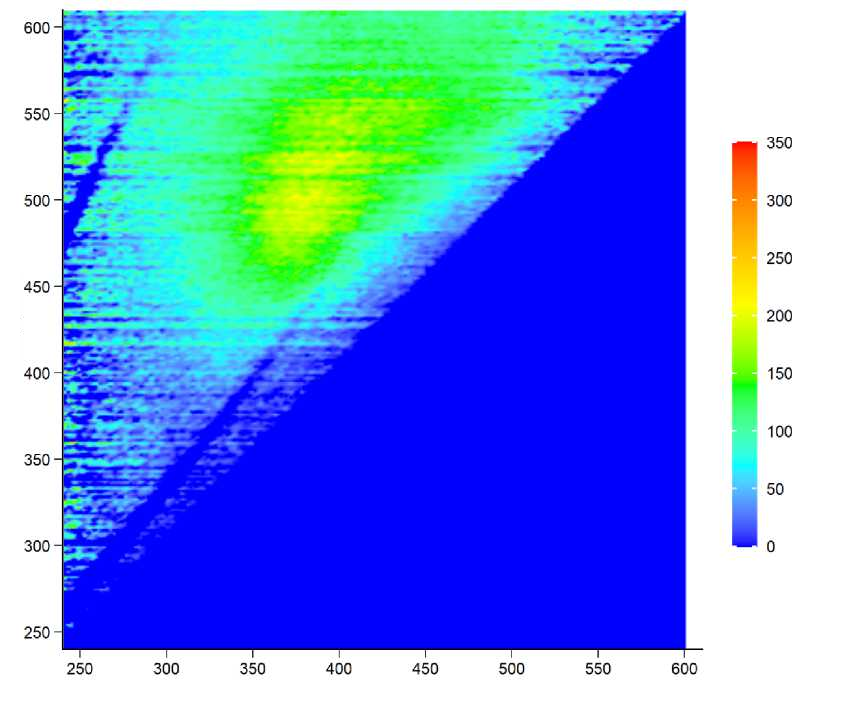
To characterize humic acids in the biostimulant, several spectroscopic analyses were used—FTIR, UV-Vis molecular absorption spectroscopy, and fluorescence 3D-EEM spectroscopy. Results are shown in Figures 2–4.
Relative transmittance. Wavenumber (cm⁻¹). O–H; ≡C–H; =C–H; C–H (aliphatic); CO₂; C=O; C=C; N–H bending; C–H bending; C–O/C–N; C–Hal / C–H (aromatic).
Figure 2. FTIR spectrum of humic acids extracted from the biostimulant.
The FTIR spectrum of natural peat humic acids shown in Figure 2 is typical of a heterogeneous humic acid matrix with many polar functional groups and an aromatic–aliphatic structure. The broad, pronounced band around 3600–3200 cm⁻¹ corresponds to O–H stretching vibrations (phenols, alcohols, carboxylic acids) and usually also indicates strong hydrogen bonding. Weaker features around ~3100–3000 cm⁻¹ suggest aromatic or olefinic structures, while bands around ~2920 cm⁻¹ and ~2850 cm⁻¹ characterize aliphatic C–H (CH₂/CH₃) stretching, i.e., side chains and lignin fragments. A key humic-acid feature is typically strong absorption around ~1720–1700 cm⁻¹, which is visible here as a substantial signal and corresponds to C=O stretching (mainly carboxyl groups, but also possible esters/ketones)—an important indicator of humic acid acidity and metal-complexing ability. In the region ~1620–1580 cm⁻¹, aromatic C=C and/or contributions of conjugated carbonyl groups dominate, indicating an aromatic skeleton (lignin/humification products). Around ~1550–1500 cm⁻¹, N–H bending features of amides may appear, while bands ~1450–1380 cm⁻¹ are usually associated with C–H bending and a possible component of symmetric COO⁻ vibrations. In the “fingerprint” zone ~1250–1000 cm⁻¹, C–O and C–O–C (phenols, alcohols, ethers, polysaccharide residues) and partly C–N vibrations are observed, reflecting the diversity of humic substances. At ~900–700 cm⁻¹, aromatic C–H out-of-plane bending is observed, whereas the band around ~2350 cm⁻¹ is a typical CO₂ signal (adsorbed from the atmosphere) and usually is not an indicator of the sample structure itself. Overall, the spectrum confirms that carboxyl and phenolic groups on an aromatic base with an admixture of aliphatic chains dominate in the humic acids present in the biostimulant, consistent with their high reactivity and complexing/biostimulatory potential.
Absorption, a.u. E2/E3 = 2.7; E2/E4 = 8.1; E2/E6 = 62; E4/E6 = 7.8.
Figure 3. UV-Vis molecular absorption spectrum of humic acids extracted from the biostimulant.
The UV-Vis spectrum in Figure 3 indicates a typical humic-acid feature: a smoothly decreasing absorbance without narrow distinct peaks, which points to a broad mixture of chromophores (aromatic, phenolic, carbonyl groups, etc.) and structures. The calculated E4/E6 = 7,8 is higher than the typical value for humic acids (<5), thus indicating a higher degree of humification, higher average molecular mass, and more condensed, more aromatic structures. E2/E3 = 2,7 (lower than the frequently cited range of 3–5) indicates a relatively higher share of more conjugated/humified components absorbing at 365 nm and a shift toward more strongly humified organic matter. E2/E4 = 8,1 indicates a pronounced presence of lignin-derived functional groups and signs of aromaticity, whereas E2/E6 = 62 reflects a shift of the balance in favor of a less humified and less condensed fraction with smaller aggregates. Overall, it can be concluded that the peat humic acids extracted from the biostimulant are a heterogeneous mixture containing both aromatic/lignin fragments and a substantial share of a lighter, less humified fraction, which is usually associated with better solubility and availability of functional groups.
Emission, nm Excitation, nm Intensity, au.
Figure 4. FLR 3D-EEM spectrum of humic acids extracted from the biostimulant.
In the 3D-EEM matrix (Figure 4), a broad humic-acid fluorescence region is visible with a maximum at approximately Ex ~390–430 nm and Em ~520–560 nm (yellow field), indicating strongly conjugated, aromatic, and relatively more condensed structures (a more humified fraction characteristic of peat). In addition, a “shoulder” is visible around Ex ~320–360 nm; Em ~440–500 nm, which is characteristic of humic acids, and a weaker component around Ex ~250–280 nm; Em ~420–460 nm, which is more characteristic of lignin components. Overall, the spectrum shows that the sample is a heterogeneous mixture of chromophores with different degrees of humification. At the same time, the protein-like fluorescence region (tyrosine/tryptophan-type signals around Ex ~275 nm and Em ~300–350 nm) is practically not expressed, indicating a low proportion of easily degradable impurities and an overall dominance of more stable humic substances.
To characterize the effectiveness of the biostimulant with respect to its impact on crop germination, germination tests were performed. An example of a germination plate for wheat is shown in Figure 5.
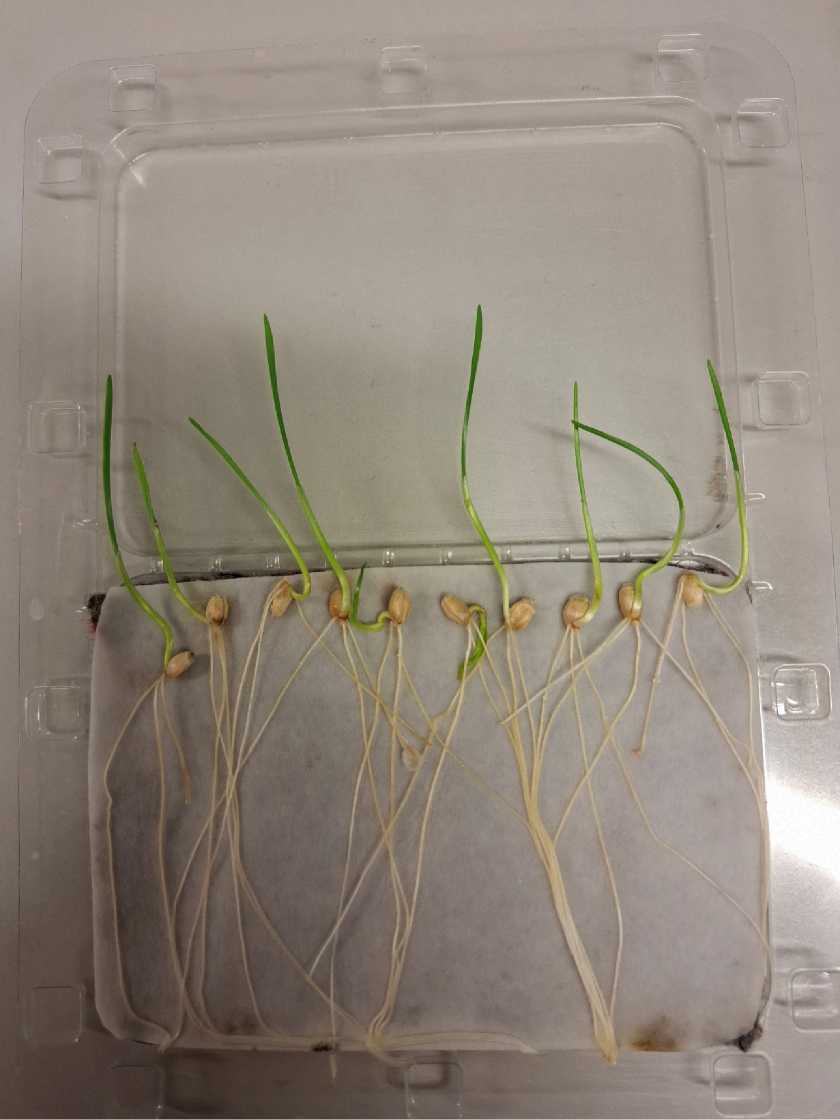
Figure 5. Germination plate with sprouted wheat for the control sample.
Figure 5 shows a germination plate where, after 7 days of germination, wheat sprouted using deionized water. The effect of the bio stimulant on oat germination is shown in Figure 6 (length) and Figure 7 (mass).
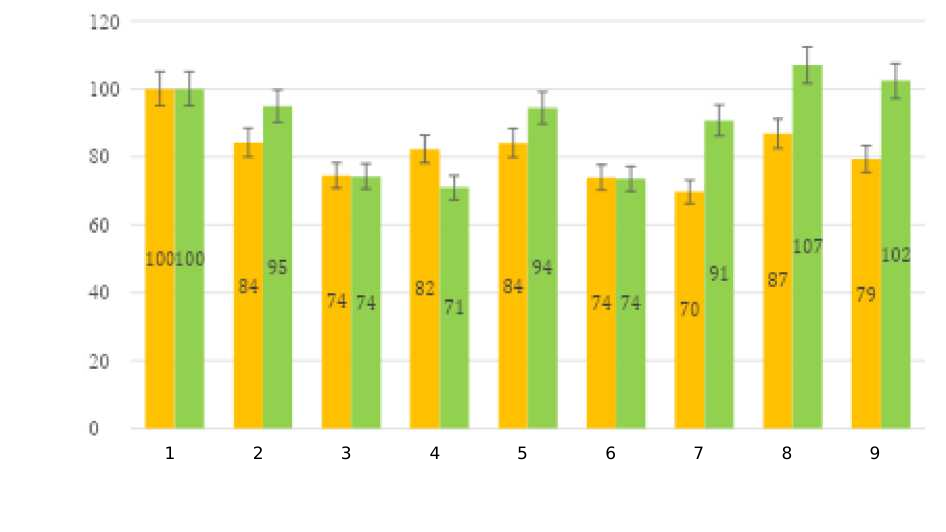
Yellow: roots. Green: shoots. Groups 1–9 follow the treatment order listed below.
Plant-part length relative to the control, %. Root length. Shoot length. Control; 1:500; 1:500 with seed pretreatment; 1:350; 1:350 with seed pretreatment; 1:200; 1:200 with seed pretreatment; 1:100; 1:100 with seed pretreatment.
Figure 6. Results of oat germination tests for root (yellow bars) and shoot/seedling (green bars) length after 7 days, normalized to the control.
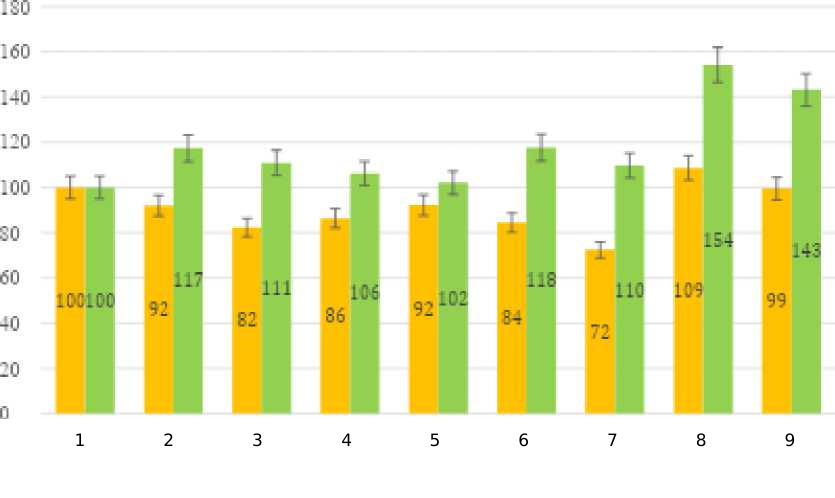
Yellow: roots. Green: shoots. Groups 1–9 follow the treatment order listed below.
Plant-part mass relative to the control, %. Root mass. Shoot mass. Control; 1:500; 1:500 with seed pretreatment; 1:350; 1:350 with seed pretreatment; 1:200; 1:200 with seed pretreatment; 1:100; 1:100 with seed pretreatment.
Figure 7. Results of oat germination tests for root (yellow bars) and shoot/seedling (green bars) mass after 7 days, normalized to the control.
Figure 6 shows the result of oat germination tests for plant-part length, normalized to the control where oats were germinated using deionized water. Results indicate that when using the biostimulant at dilutions 1:500, 1:350, and 1:200, both etched and non-etched seeds exhibited lower germination performance for both root length and shoot length. For the 1:100 dilution, non-etched and etched seeds showed higher shoot-length performance (+7% and +2%, respectively), but root length was still reduced.
Figure 7 shows the oat germination test result for plant-part mass, normalized to the control where oats were germinated using deionized water. It was observed that seed etching positively affects the actual shoot mass versus the control across all biostimulant dilutions, especially at 1:100 for both non-etched and etched seeds (+54% and +43%, respectively). However, root mass is reduced in almost all tests, except for the 1:100 dilution with non-etched seeds, which showed a +9% increase in mass. It should be noted that, with respect to shoot mass, seed etching has a negative effect compared with non-etched seeds (a 4–11% decrease).
Based on the oat germination test results, it was concluded that for further studies only root and shoot mass will be used, as it more accurately represents germination performance. Durum wheat test results are shown in Figure 8.
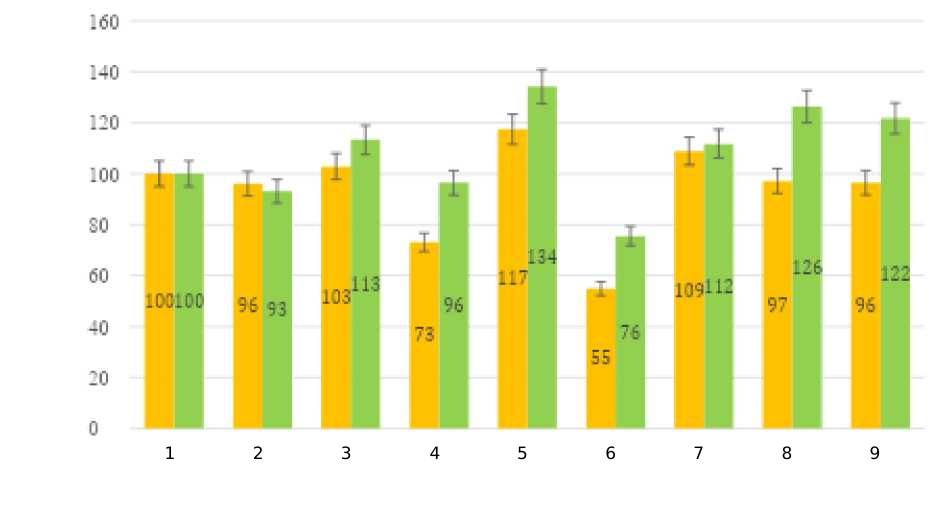
Yellow: roots. Green: shoots. Groups 1–9 follow the treatment order listed below.
Plant-part mass relative to the control, %. Root mass. Shoot mass. Control; 1:500; 1:500 with seed pretreatment; 1:350; 1:350 with seed pretreatment; 1:200; 1:200 with seed pretreatment; 1:100; 1:100 with seed pretreatment.
Figure 8. Results of durum wheat germination tests for root (yellow bars) and shoot/seedling (green bars) mass after 7 days, normalized to the control.
In the durum wheat germination test (Figure 8), it is seen that for non-etched seeds the biostimulant increases shoot mass best at a 1:100 dilution (+26%), while 1:500 gives a slight decrease (-7%), and 1:350 and especially 1:200 cause a pronounced decrease in mass (-4% and -24%, respectively). At the same time, root mass for non-etched seeds mostly decreases, with a very significant drop at 1:350 (-27%) and 1:200 (-45%), whereas 1:500 and 1:100 are close to the control (-4% and -3%). Overall, etching improves results because shoot mass is higher than the control in all dilutions (1:500 etched +13%; 1:350 etched +34%; 1:200 etched +12%; 1:100 etched +22%). Root mass also becomes higher than the control at 1:500, 1:350, and 1:200 (+3%, +17%, and +9%, respectively), although at 1:100 etching slightly reduces root mass. Comparing etched with non-etched seeds, etching provides a positive effect at dilutions 1:500–1:200, while a slight decrease is observed at 1:100, which may indicate that at higher concentration etching no longer provides additional benefit.
Finally, germination tests were performed for peas, and the germination test results for pea plant-part masses are shown in Figure 9.
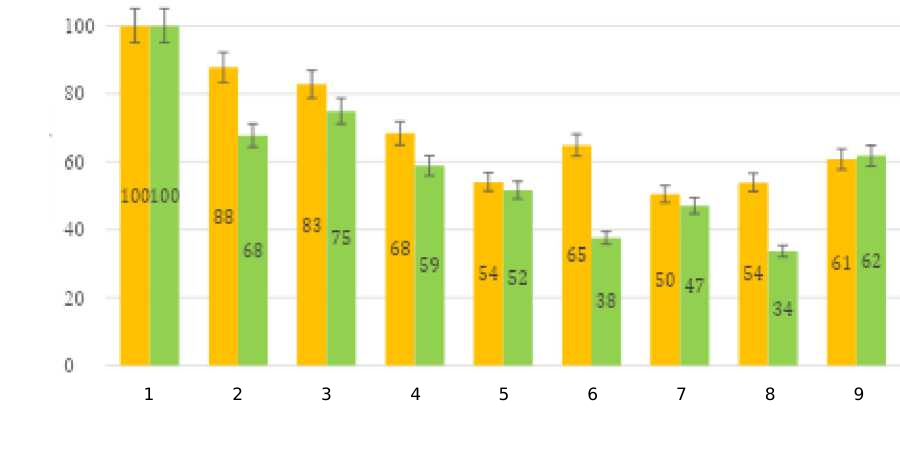
Yellow: roots. Green: shoots. Groups 1–9 follow the treatment order listed below.
Plant-part mass relative to the control, %. Root mass. Shoot mass. Control; 1:500; 1:500 with seed pretreatment; 1:350; 1:350 with seed pretreatment; 1:200; 1:200 with seed pretreatment; 1:100; 1:100 with seed pretreatment.
Figure 9. Results of pea germination tests for root (yellow bars) and shoot/seedling (green bars) mass after 7 days, normalized to the control.
In the pea germination test, the overall picture is unambiguous: the biostimulant reduces both root and shoot mass versus the control in all dilutions, and the most pronounced reduction is observed in shoot mass as the solution becomes more concentrated. For non-etched seeds, at the most dilute solution (1:500) the drop is more moderate, but moving to more concentrated solutions the effect intensifies—at 1:200 and especially 1:100, shoot mass decreases most strongly (to approximately one-third of the control). Overall, etching does not provide a stable improvement. In some dilutions it even worsens root mass (e.g., 1:350), however, in the 1:100 case etching substantially affects shoot mass, because shoot mass increases from 34% to 62% (from ~1/3 to ~2/3 of the control). Thus, for peas in this test the biostimulant acts predominantly inhibitory.
After the germination tests, it is clear that the biostimulant prototype has an unfavorable effect on peas, and possibly also on other legumes, whereas for cereals a significant positive effect was observed— for durum wheat at a 1:350 dilution with etched seeds, with a root mass increase of +17% and a shoot mass increase of +34%; and for oats at a 1:100 dilution with non-etched seeds, with a root mass increase of +9% and a shoot mass increase of +54%.